 Client Login
Understanding the Yield Curve: Trends and Implications
When it comes to finance and economics, the yield curve is a crucial concept that often garners significant attention. Despite its complexity, understanding the yield curve can provide valuable insights into economic trends and investment strategies. This guide aims to demystify the yield curve, explaining what it is, why it matters, and how it can be used to predict economic conditions.
Listen in on the Podcast
iTunes | Spotify | iHeartRadio | Amazon Music | Castbox
__
What is the Yield Curve?
The yield curve is a graphical representation of the interest rates on debt for a range of maturities. It shows the relationship between the yield (interest rate) and the time to maturity for debt securities of similar credit quality, typically U.S. Treasury bonds. The curve can take on various shapes, each reflecting different economic conditions.
Types of Yield Curves
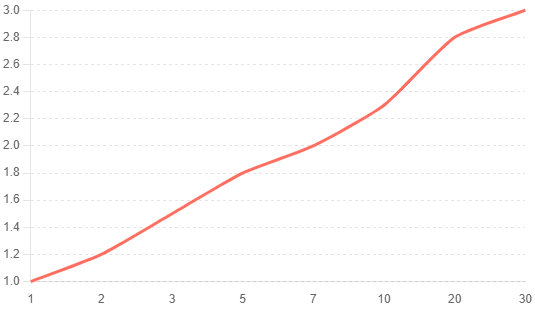
Normal: This curve slopes upward, indicating that longer-term bonds have higher yields compared to shorter-term bonds. This shape suggests a healthy, growing economy where investors expect higher returns for taking on the risk of longer-term investments.
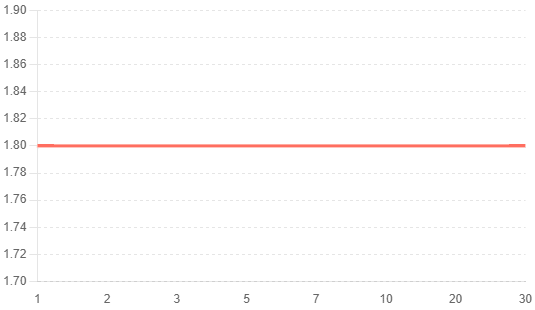
Flat: In a flat curve, short-term and long-term yields are very close to each other. This situation often occurs during transitions between normal and inverted yield curves and can indicate uncertainty in the economic outlook.
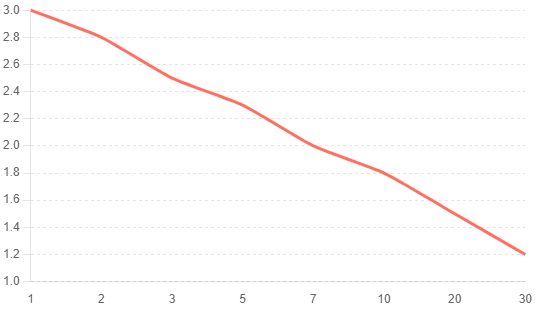
Inverted: An inverted yield curve slopes downward, meaning that short-term yields are higher than long-term yields. This unusual situation often signals that investors expect economic downturns or recessions, as they prefer to lock in long-term investments at lower yields rather than risk short-term investments.
Why Does the Yield Curve Matter?
The yield curve is a critical indicator for economists, investors, and policymakers for several reasons:
Economic Indicator
The yield curve is often used to predict economic conditions. A normal yield curve typically indicates a strong economy, while an inverted yield curve has historically preceded recessions. For example, since the 1950s, each U.S. recession has been preceded by an inverted yield curve, making it a valuable forecasting tool.
Interest Rate Expectations
The shape of the curve reflects market expectations about future interest rates. If the curve is steeply upward-sloping, it suggests that investors expect interest rates to rise in the future. Conversely, an inverted curve indicates expectations of falling interest rates, often due to anticipated economic slowdowns.
Investment Strategies
Investors use the curve to inform their investment decisions. For instance, a steep yield curve might encourage investments in long-term bonds to capitalize on higher yields. Conversely, an inverted curve may prompt investors to shift to shorter-term securities or other asset classes to avoid potential losses from falling interest rates.
Components of the Yield Curve
To fully understand the yield curve, it is essential to grasp its key components:
1. Interest Rates: The yield curve primarily reflects the interest rates of bonds, which are influenced by various factors, including monetary policy, inflation expectations, and economic growth.
2. Maturity: Maturity refers to the time remaining until the bond’s principal amount is repaid. It typically includes bonds with maturities ranging from one month to 30 years.
3. Credit Quality: The curve often focuses on bonds of similar credit quality, such as U.S. Treasury securities, which are considered risk-free. Comparing bonds of different credit qualities can lead to misleading conclusions.
Factors Influencing the Yield Curve
Several factors influence the shape and movement of the yield curve:
1. Monetary Policy
The Federal Reserve (Fed) plays a significant role in shaping the yield curve through its monetary policy actions. By adjusting the federal funds rate, the Fed influences short-term interest rates. For instance, if the Fed raises rates to combat inflation, short-term yields may increase, steepening the yield curve. Conversely, if the Fed lowers rates to stimulate the economy, short-term yields may decrease, flattening or inverting the curve.
2. Inflation Expectations
Inflation expectations are a critical driver of long-term yields. If investors expect higher inflation in the future, they demand higher yields on long-term bonds to compensate for the erosion of purchasing power. This expectation can steepen the curve. On the other hand, if inflation is expected to remain low, long-term yields may stay subdued, leading to a flatter curve.
3. Economic Growth
The yield curve reflects market sentiment about future economic growth. In a growing economy, investors expect higher returns from long-term investments, resulting in a normal or steep curve. Conversely, during periods of economic uncertainty or anticipated slowdowns, investors may prefer the safety of long-term bonds, flattening or inverting the curve.
4. Supply and Demand Dynamics
The supply and demand for bonds also impact the yield curve. For instance, if the government issues a large number of long-term bonds, the increased supply may push long-term yields higher. Similarly, strong demand for short-term bonds can drive short-term yields lower, influencing the overall shape of the yield curve.
Economic Predictions
The yield curve’s ability to predict economic trends is one of its most valuable features. Let’s explore how different curve shapes correlate with economic conditions:
Normal: A Sign of Economic Health
A normal curve indicates that the economy is growing steadily. In this scenario, short-term interest rates are lower than long-term rates, reflecting investor confidence in future economic expansion. Businesses and consumers are likely to borrow and invest more, fueling further growth.
Flat: A Transition Phase
A flat curve often signals a transition phase in the economy. It can occur when the economy is moving from growth to stagnation or vice versa. This shape suggests uncertainty, with investors unsure about the direction of future interest rates and economic conditions.
Inverted : A Recession Warning
An inverted curve is a strong predictor of economic recessions. When short-term yields exceed long-term yields, it indicates that investors expect future economic difficulties and lower interest rates. This inversion typically occurs when the Fed raises short-term rates to combat inflation, but long-term rates remain low due to expectations of slowing growth.
Historical Examples and Predictions
1. The 2008 Financial Crisis
The yield curve accurately predicted the 2008 financial crisis. In 2006, it was inverted, signaling an impending recession. By late 2007, the economy entered a severe downturn, culminating in the financial crisis of 2008. The inversion provided a clear warning of the economic troubles ahead.
2. The COVID-19 Pandemic
The yield curve also played a role in predicting the economic impact of the COVID-19 pandemic. In 2019, it briefly inverted, raising concerns about a potential recession. While the pandemic was an unforeseen event, the inverted curve reflected underlying economic vulnerabilities that were exacerbated by the crisis.
Practical Applications
Understanding the yield curve can help investors and policymakers make informed decisions. Here are some practical applications:
1. Investment Strategies
Investors can use this graph to develop investment strategies that align with their risk tolerance and economic outlook. For instance, during a steep curve, investors might prefer long-term bonds to capitalize on higher yields. Conversely, an inverted curve might prompt a shift to shorter-term securities or alternative investments.
2. Portfolio Management
Portfolio managers often monitor it to adjust their asset allocations. By analyzing the curve’s shape and movement, they can make informed decisions about bond durations, sector allocations, and risk management strategies. For example, during periods of economic uncertainty, managers might increase exposure to high-quality, shorter-term bonds to reduce risk.
3. Economic Policy
Policymakers, including central banks, use the yield curve to guide monetary policy decisions. By understanding the curve’s implications for economic growth and inflation, they can adjust interest rates, implement quantitative easing, or take other measures to stabilize the economy. It provides valuable insights into market expectations and helps policymakers anticipate potential economic challenges.
Conclusion
The yield curve is a powerful tool that offers valuable insights into economic trends, interest rate expectations, and investment strategies. By understanding the different shapes and the factors influencing it, investors and policymakers can make more informed decisions. Whether predicting economic recessions or guiding investment strategies, it remains an essential indicator in the world of finance and economics.
For personalized financial advice and to learn how the yield curve might impact your financial plan, give us a call. We are here to help you navigate the complexities of the financial markets and achieve your financial goals.